
If the US has not yet entered a new “golden age,” by the looks of the stock market, many people are nonetheless doing quite well, especially founders and others with a large stake in the meteoric rise of several successful tech companies. It is therefore not surprising that a new paper by Berkeley economists finds rising wealth concentration at the top in recent years, with the largest fortunes primarily held in public and private businesses.
The authors additionally calculate effective taxA tax is a mandatory payment or charge collected by local, state, and national governments from individuals or businesses to cover the costs of general government services, goods, and activities. rates (ETRs) based on that wealth, delivering the tantalizing but ultimately misleading result that the wealthiest Americans pay a lower ETR than the rest of us due to the 2017 Tax Cuts and Jobs Act (TCJA).
Exaggerated Top Income Definition Skews Study
Specifically, the authors find that US federal, state, and local taxes as a share of “economic income” for the top 0.0002 percent (roughly the top 400 wealthiest Americans) averages to 23.8 percent from 2018 to 2020, compared to about 30 percent for the US population as a whole and 45 percent for top labor income earners. Prior to the TCJA, the study finds the top 400’s ETR was closer to 30 percent, with the drop since then mainly due to reduced business taxes and the growth of wealth and economic income at the top. As the authors state, “these low effective rates [after TCJA] are due substantially to a low ratio of taxable to economic income at the top of the wealth distribution.”
And therein lies the rub. ETR estimates are usually based on something like taxable income, but this study uses a much more expansive definition of income that is well beyond what most people understand income to be. The authors define economic income as labor plus capital income, with capital income for the wealthiest defined by the profits of the businesses they own. Specifically, the authors estimate the shares of businesses owned by the top 400 and then allocate the unrealized book profits of those businesses to the owners in accordance with their shares.
This theoretical flow of profits to the individual owner in the same year they are reported is then misleadingly matched with actual taxes paid in the given year (both at the business entity level and by the individual). The effect is to greatly overstate the income of high-net-worth individuals and understate their ETR.
Corporate profits only become taxable income for shareholders after being distributed as dividends or realized as gains. Typically, a large portion of profits is retained to fuel future growth of the company, and owners only realize gains after holding shares for several years. The study documents that the wealthiest Americans also own pass-through businesses, and those profits are passed through to the owners as they are earned. However, only taxable profits are passed through as opposed to the more expansive definition of book profits assumed by the study’s authors.
David Splinter, an economist at the Joint Committee on Taxation, finds the study overstates the wealth and income of the top 400 taxpayers, since it does not split family wealth across multiple tax returns. The study also understates the income of the bottom half of the population, since it does not account for transfers. Making these and other adjustments, Splinter finds the opposite result for the same period (2018 to 2020): the top 400 ETR is 13 percentage points higher than the overall population’s ETR (38 percent versus 25 percent).
Study Uses Questionable Window of Analysis
Another flaw in the study is including the pandemic year 2020, which is tainted by massive business losses that would not be representative of a typical year. Furthermore, it is unlikely the study’s results would hold if extended beyond 2020, after which federal tax revenue, and especially corporate tax revenue, rebounded strongly. Part of this rebound was due to the timing effects of the TCJA’s business tax cuts.
The authors point to the TCJA’s expensing provision (bonus depreciationDepreciation is a measurement of the “useful life” of a business asset, such as machinery or a factory, to determine the multiyear period over which the cost of that asset can be deducted from taxable income. Instead of allowing businesses to deduct the cost of investments immediately (i.e., full expensing), depreciation requires deductions to be taken over time, reducing their value and disco) as a factor that greatly reduced taxable business income, but not economic income. But it is well known that expensing effectively shifts forward deductions that would have otherwise occurred in the future, so that would suggest the authors’ finding of a low ETR in the 2018-2020 period is temporary and not reflective of ETRs in the years after 2020.
US Top ETR Is High Relative to Peers
As it is, based on the authors’ measure of ETRs, they note that top-end ETRs are higher in the US than in many European countries, including the Netherlands, Sweden, and Norway. They attribute this in part to the widespread use of personal wealth-holding companies in Europe that allow high-net-worth individuals to avoid the individual income taxAn individual income tax (or personal income tax) is levied on the wages, salaries, investments, or other forms of income an individual or household earns. The U.S. imposes a progressive income tax where rates increase with income. The Federal Income Tax was established in 1913 with the ratification of the 16th Amendment. Though barely 100 years old, individual income taxes are the largest source.
Another unstated factor is that the US does not have particularly low taxes on business and other capital income earned by high-net-worth individuals, and, by some measures, the US is above average relative to other countries. The US corporate tax rate, including both federal and state taxes, is about 5 percentage points higher than the average corporate tax rate among European countries. The top US capital gains taxA capital gains tax is levied on the profit made from selling an asset and is often in addition to corporate income taxes, frequently resulting in double taxation. These taxes create a bias against saving, leading to a lower level of national income by encouraging present consumption over investment. rate is about 10 percentage points higher than the average among Organisation for Economic Co-operation and Development (OECD) and select EU countries.
Ultimately, what makes sense is to ensure that US taxes are competitive and indeed attractive to highly mobile capital. The TCJA did just this. It reduced the corporate tax rate from the highest in the OECD to more near the middle of the pack and simultaneously improved the business tax baseThe tax base is the total amount of income, property, assets, consumption, transactions, or other economic activity subject to taxation by a tax authority. A narrow tax base is non-neutral and inefficient. A broad tax base reduces tax administration costs and allows more revenue to be raised at lower rates. by allowing companies to immediately expense investment. Some of these ideas were carried forward in this year’s One Big Beautiful Bill Act (OBBBA), namely permanent full expensingFull expensing allows businesses to immediately deduct the full cost of certain investments in new or improved technology, equipment, or buildings. It alleviates a bias in the tax code and incentivizes companies to invest more, which, in the long run, raises worker productivity, boosts wages, and creates more jobs. for equipment, domestic research and development, and (temporarily) certain structures.
Federal Tax Code Is Highly Progressive
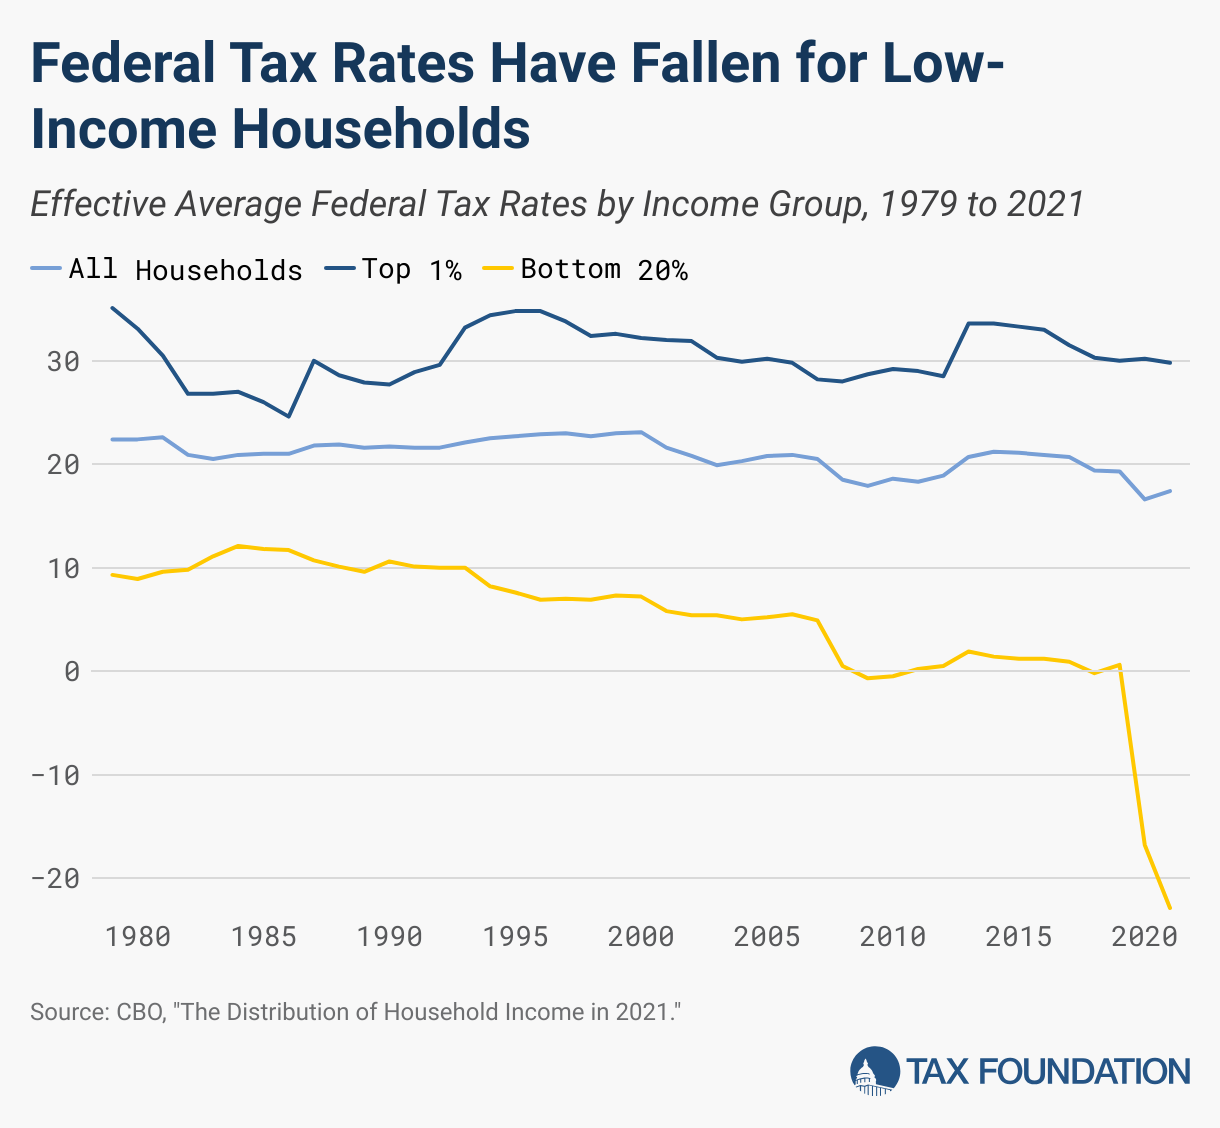
As for ETRs, more standard approaches generally indicate that US federal taxes are highly progressive and that the tax code’s progressivity has increased over time, even since the TCJA by some measures. For instance, according to the latest estimates from the Congressional Budget Office (CBO), which accounts for all federal taxes (but not state or local), the top 1 percent of earners in 2021 had an ETR of 29.8 percent, compared to 17.4 percent for the population as a whole and -22.9 percent for the bottom 20 percent of households.
Pandemic relief programs, including generous refundable tax credits, explain the particularly low and negative ETRs for low-income households in 2021. However, ETRs had been trending down for low-income households prior to the pandemic. For instance, the bottom 20 percent of households had an ETR of about 10 percent in the 1980s and early 1990s before trending down to 0.6 percent in 2019. In contrast, the top 1 percent of earners had an ETR of 30.0 percent in 2019, slightly higher than the average ETR for this group during the 1980s and early 1990s. Many other studies support this basic result, attributing the drop in ETRs for low-income households since the 1980s to increasingly generous refundable tax credits such as the earned income tax credit and child credit.
As most of the pandemic relief programs have wound down, ETRs have generally bounced back to pre-pandemic levels. The OBBBA does not greatly alter the downward trend of ETRs for low-income households, according to analysis by the Joint Committee on Taxation.
Targeting wealth at the top through higher taxes has a certain appeal, but it also comes with a lot of drawbacks, including increased avoidance and reduced incentives to invest. The economy would not be humming along without the innovation, investment, and potentially massive productivity gains arising from America’s tech sector and its entrepreneurs. Raising taxes on the most successful entrepreneurs and their businesses risks knocking out a key growth pillar for the stock market and the economy more broadly, reducing retirement savings (most Americans own stock), productivity, wages, and job opportunities.
Stay informed on the tax policies impacting you.
Subscribe to get insights from our trusted experts delivered straight to your inbox.
Share this article